Debt/GDP Math Refresher

One of the joys about writing about bond markets is that I always get questions in real life (e.g., during a curling bonspiel) about whatever crisis du jour is being spread about bond markets. The thing to keep in mind: if you are a developed country with a freely-floating currency that you control, it takes a concentrated dose of stupidity to create crisis in your government bond market. Unfortunately, concentrated doses of stupidity are in great supply in the 2020s.
However, if we avoid stupidity, do we need to worry about debt levels? The answer is: one needs to worry about inflation created by fiscal and other policies (looking at you, tariff policy), but the debt-to-GDP ratio will take care of itself.
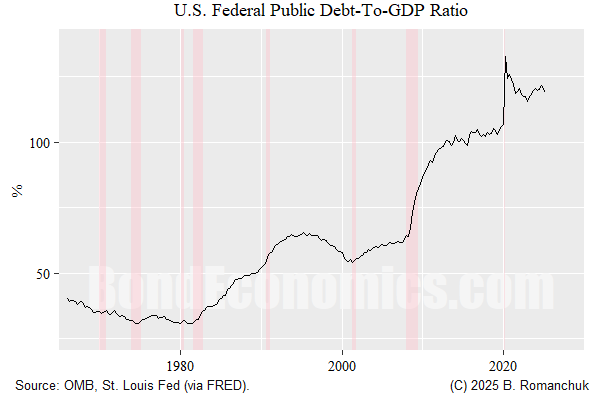
Let us take a look at the American debt-to-GDP ratio in the figure above. The latest figure (from the second quarter of last year) is at around 118%. For some reason, people get into a panic about a debt-to-GDP ratio of 100%, but that is a superstition and/or relying on a bogus study (see the appendix).
The thing people forget about the debt-to-GDP ratio is that it is a ratio. At a level of 118%, what do you thing the level of the deficit required to lower it by 5% to 113% if nominal GDP growth is 5% (roughly current levels)?
You need a small deficit of around 1/2% of GDP. That is right, a deficit, not a fiscal surplus. If you managed to balance the budget without tanking nominal GDP growth (admittedly, not easy), the growth in the GDP denominator would “reduce the ratio” by a factor of 5% (new ratio = old ratio/1.05, not (new ratio as a %) = (old ratio as a %) - 5%).
Getting to a balanced budget is normally very difficult, but if you keep the deficit at 3% of GDP (which is fairly typical for modern economies outside of recessions), the debt-to-GDP ratio will converge on 60% eventually (albeit slowly). Given that deficits blow out in recessions, you probably need a slightly lower deficit to get there in practice.
Well, How Did We Get Here?
The secular rise in the debt-to-GDP ratio comes courtesy of the focus on inflation control in the neoliberal era. If you look at where the ratio bottomed in the chart, it was during the peak of inflation around 1980. This is not coincidental: high inflation raises nominal GDP growth, since real GDP growth is relatively stable (since it is driven by the real productive capacity of the economy). We can also add into the fact that we have had a secular change in how households hold wealth — we have much wealthier rich and middle class households who have pension and insurance assets. If the household sector wants to hold a greater stock of financial assets that includes fixed income, flows have to adjust to allow that increased saving to occur. (That is, growth is slower due to lower consumption, which raises the fiscal deficit.) The demand for financial assets creates the supply (fiscal deficits).
The deficit then took off once we got past the relatively high-growth mid-2000s. The housing market got caulked, and deficits exploded as governments patched the hole in the economy created by the demise of housing. We then got the pandemic deficits. Meanwhile, the American government kept lowering tax rates on the rich, which means you have a fiscal policy that generates the least amount of economic growth per a unit of government deficits.
Can the Ratio Grow “Out of Control?”
As the ratio grows, you need an even larger fiscal deficit to keep up nominal GDP growth. For example, let us say the net debt-to-GDP ratio magically jumped to 200%. If nominal GDP growth is still 5%, you need a fiscal deficit of 10% of GDP just to keep the ratio unchanged. That is a very large flow of income relative to the size of the economy. You can get deficits of 10% of GDP during deficits or total wars (where you typically run rationing schemes to control inflation), but it is hard to sustain such a deficit in peacetime in an expansion without inflation blowing out (which contradicts the 5% nominal GDP growth assumption).
Note that I am discussing net debt. Japan has very high gross debt, but that was only achievable courtesy of arms of governments having high government debt holdings. This is described in a 2025 paper (I discussed it years ago) by the St. Louis Fed. The gross debt is given as 270%, but net debt is 78%. It is possible to write extremely large IOU’s to yourself and not affect the economy. (If I write an IOU to myself for eleventy quadrillion dollars, I have both an asset and a liability that cancel each other out.) In Japan’s case, it is a bit more complicated, but this is just intra-governmental accounting,
In the absence of secular policy changes, the (net) debt-to-GDP ratio can easily bounce around current levels on a “sustainable” basis.
How Do We Lower The Ratio?
We need to reverse the trend in modern fiscal policies: increase the fiscal balance with the least effect on nominal GDP growth. That is, soak the rich in taxes. Alternatively, rich people can learn to stop yapping about the perils of government debt.
Appendix: Oh Noes, 100% Debt-to-GDP!
To paraphrase Abba Lerner, a 100% debt-to-GDP ratio is what happens when the (face) value of government debt equals the value of the flow of domestic production that occurs during the period when the Earth completes one orbit around the Sun. (In a frame of reference where the Sun is immobile, the actual path of the Earth is some kind of spiral that does not close on itself.)
When put that way, the concept seems kind of stupid. The reason is that is slightly stupid — we are comparing the stock of government debt to a flow of income. To be strictly comparable quantities, we need to compare stocks to stocks, or flows to flows. For example, my argument that a fiscal deficit of 10% is “big” during an expansion is a flow-to-flow comparison — it is hard to sustain non-inflationary growth in an expansion if the government is injecting net financial assets that is 10% of Gross Domestic Income (which equals GDP).
The reason why we compare debt levels to GDP is because GDP is the most natural scaling variable. Government debt levels are large numbers, because modern economies are really big because there are oodles of people living in said economies with high incomes. It is much easier to compare government finance across countries, or the same country over time by scaling by GDP. But since it is an arbitrary scaling factor, there is no reason to believe that 100% is a “magic level.”
That said, there was a famous paper in the 2010s that was wrong about debt at 90% of GDP being a “magic” threshold for economies. (It was based on a spreadsheet error.) Although that paper was wrong, one can say that net debt levels over 80% of GDP (ballpark threshold) do have one property — interest payments on debt start to become a decent portion of fiscal deficits. This raises the issue that raising interest rates could prove to be inflationary, which is a heated topic that shows up in MMT debates (as discussed in my MMT primer). I might do an article recapping MMT “interest debates” next week.
Brian
thank you very much for this. i need to study it a bit so i have it in my mind tocompare it with the doomsayers on line.
But here are a couple of thoughts: what about "animal spirits" of the actual players, including the very big banks including the World Bank etc:
If the debt was a real problem, the fix would be to raise taxes...unless of course the rich are right that if we taise taxes they will take their money and go home, tanking GDP.
i am fairly sure that the "debt" they are projecting for the future includes the cost of paying for Social Security if the Trust Fund runs out. But the fact is that Social SEcurity is paid for not by the government, not by the rich, but by the workers themselves. Those workers can ensure that their needed benefits witll be there just by raising their payroll "tax" (really savings and insurance contribution) 2% of payroll. this would not even be noticeable, let alone a "burden." moreover it can be reached by raising the tax two tenth of a percent per year for the next ten years. Doing this would lower the projected debt by something like half (something like). If we had started the incremental change years ago when it became obvious that it would solve the problem, the incremental change needed would have been less than one dollar per week per year.
Sadly, there still are economists who believe the Debt/GDP ratio has some meaning. It doesn't. The ratio tells us nothing about the health of an economy, nothing about the health of the government's finances, nothing about the future, nothing about the past, and nothing about . . . well. . . anything.
Go to https://worldpopulationreview.com/country-rankings/debt-to-gdp-ratio-by-country, which compares ratios for most nations, and you will learn nothing about any of the Monetarily Sovereign nations -- those nations that create and use their own currency. You will see sick nations near the top and bottom of the list, intermixed with healthy nations at random.
Some economists claim the ratio indicates a nation's ability to pay its bills. It does not. Others claim it indicates a nation's ability to borrow. It does not.
Federal "debt" (which neither is federal nor debt) is the total of DEPOSITS into T-security accounts. Most of those dollars are owned by private citizens or foreign governments, not the U.S. government.
To pay off the so-called "debt," the federal government merely returns the dollars in those accounts. The dollars always remain the property of the depositors, so returning them is just a transfer from one depositor account to another -- similar to transferring dollars from your checking account to your savings account. It's as though you claimed your checking account owed your savings account.
The government also could reduce the ratio simply by spending more. Every dollar spent by the government reduces the ratio. So if a big ratio scares you, demand a massive increase in federal spending
So please, please, please, let's have no more concerns about the meaningless DEBT/GDP ratio. Perhaps shift to a discussion about what kind of cheese the moon is made of. That would be more realistic.